West Village BID
Project Overview
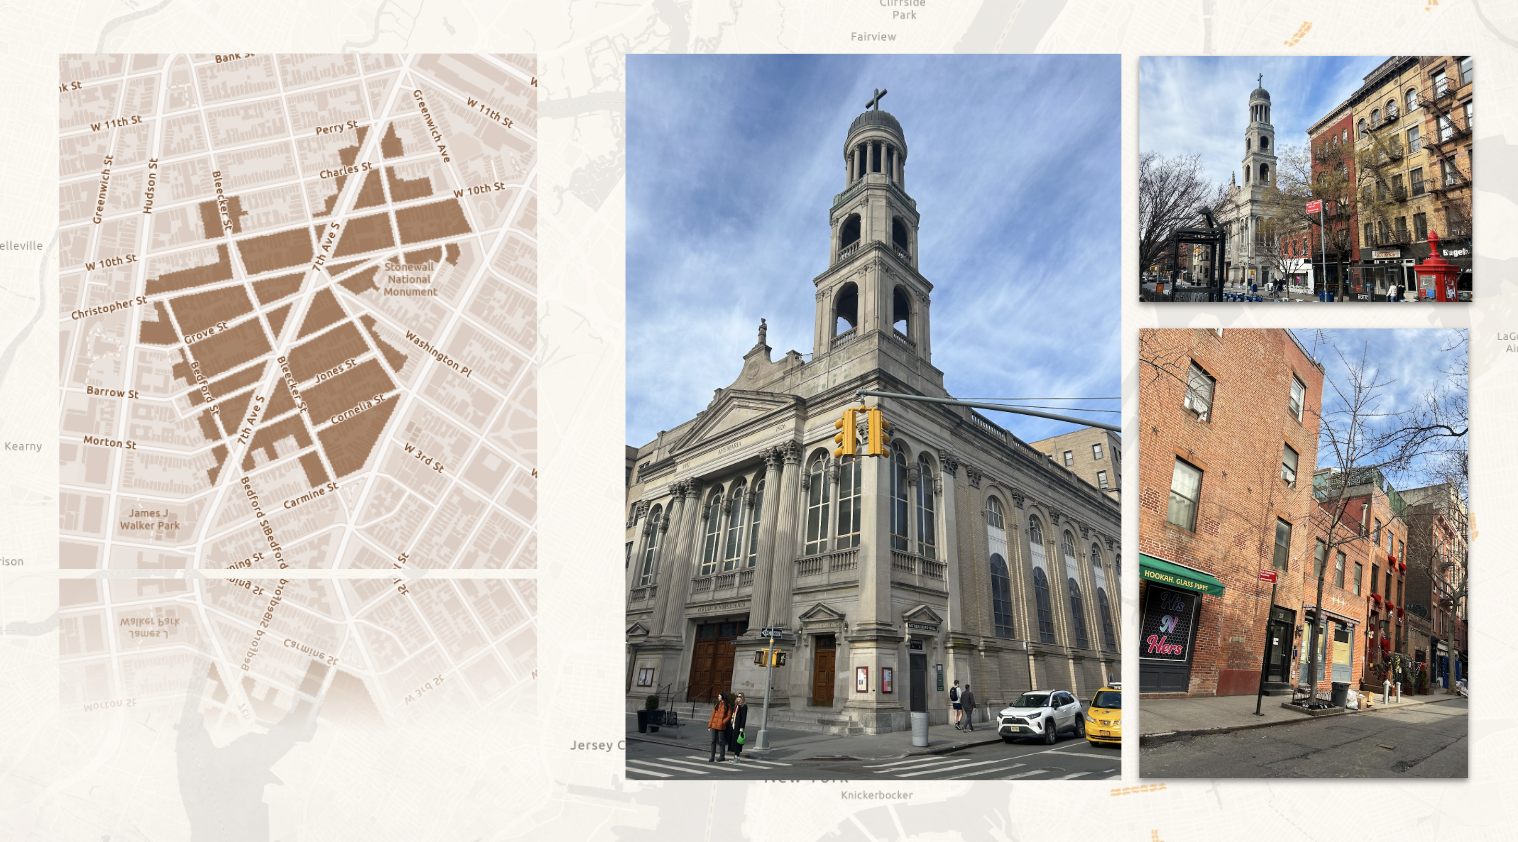
The West Village Business Improvement District serves one of Manhattan's most iconic and historic neighborhoods. Established in 2007, the BID supports local businesses in an area known for its distinctive architectural character, winding streets, and vibrant mix of shops, restaurants, and cultural venues. The district encompasses several blocks of primarily commercial streets within the larger West Village neighborhood.
Insight Analysis
West Village BID - Insight
West Village BID, established in 2022, is the fourth newest business improvement district in New York City. Covering approximately 46 acres (0.07 square miles), it is relatively small compared to other major city districts. With a moderate annual budget of around $595,000, the BID mainly focuses on providing essential services such as sanitation and public safety. Situated within the historic Greenwich Village Historic District, an area celebrated for its rich cultural and architectural legacy, West Village BID is surrounded by older, well-established BIDs like the Village Alliance (founded in 1993) and the Union Square Partnership (founded in 1984).
Key Observations
- Land Use: Predominantly mixed residential and commercial buildings, with higher density toward the north.
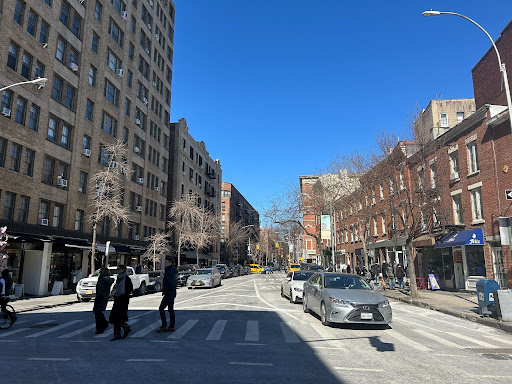
- Mobility: 7th Avenue South serves as a major traffic corridor, while Bleecker Street and Christopher Street are more pedestrian-focused.
- Public Spaces: Parks like Father Demo Square and the Stonewall National Monument serve as important community spaces.
Challenges Identified
- Sanitation: Garbage pickup was reduced during the pandemic and has only recently returned to pre-pandemic levels; maintaining cleanliness remains a priority.
- Pedestrian Experience: Narrow sidewalks in parts of the district combined with heavy foot traffic pose challenges for walkability.
- Business Dynamics: Restaurants, boutique shops, and cultural venues experience varying levels of activity, with concerns related to safety and sanitation expressed during interviews.
Insight Visualization 1
Insight Visualization 2
Transformation Analysis
West Village BID - Transformation
West Village’s historic streets are struggling to accommodate today’s pedestrian volumes, commercial churn, and tourist pressure. Targeted sidewalk widening and heritage-styled streetscape upgrades directly tackle current issues, restoring safe pedestrian flow, reinforcing the area’s cultural identity. Through these interventions, we’re shaping a future that respects the past while supporting local businesses and the community.
Current State
- Narrow Sidewalk: on Bleecker street, queues outside storefronts + two-sided parking cut pedestrian level-of-service.
- Limited Rest Area: lacks pedestrian-friendly elements (e.g. benches)
- Fragmented streetscape language: mix of modern fixtures next to landmark façades undermines sense of place
Interventions
- Removing parking space: provide more space for pedestrain
- Pavement expansion: provide more space for walking, accessibility, and outdoor seating and will have more foot traffic & higher retail engagement
- Adding historically inspired design elements: like historic barriers, retro-style streetlights, and vintage benches to create a historical and attractive environment for both residents and visitors
Estimate Cost
| Element | Estimated Cost per Unit | Total Units (Approx.) | Total Cost Estimate |
|---|---|---|---|
| Vintage Bench | $2,000 – $4,000 per bench | ~5 – 8 | ~$10,000 – $32,000 |
| Historic Barrier | $500 – $1,500 per section | ~8 – 12 | ~$4,000 – $18,000 |
| Retro Streetlight | $2,000 – $8,000 per light | ~3 – 5 | ~$6,000 – $40,000 |
| Installation Costs | $500 – $5,000 per element | – | ~$4,000 – $40,000 |
| Permitting & Misc. | Varies (5–10 % of project) | – | ~$3,000 – $10,000 |
| Total Estimated Budget | – | – | ~$30,000 – $110,000 |
Estimate Timeline
| Phase | Time | |
|---|---|---|
| Design & Planning | 1 – 2 months | Month 0 – 2 |
| Permitting & Approvals | 2 – 4 months | Month 2 – 6 |
| Procurement & Manufacturing | 3 – 6 months | Month 6 – 12 |
| Installation | 1 – 2 months | Month 12 – 14 |
| Total Estimated Timeline | ≈ 7 – 14 months |
Estimate Impact
| Walkability Intervention (Phase 1) | Aesthetic Intervention (Phase 2) | |
|---|---|---|
| Cost | Low (trial run) | Moderate |
| Trade-off | Loss of parking may inconvenience visitors and residents who rely on cars | Long-term maintenance costs to keep the elements in good condition |
| Impact | More space for walking, accessibility, and outdoor seating → higher foot traffic & retail engagement | More historical and attractive environment → increased visitors & local commerce |
| Summary | Prioritizing long-term pedestrian and business benefits | Prioritizing historical enhancement |
Challenges and Strategies
- Funding
- Public grants (historical preservation funds), private donors, and BID budgets
- Start with a trial project on a high-foot-traffic street, then expand based on success
- Consider public-private partnerships
- Permitting and Landmark Regulations
- Work closely with city agencies (Landmarks Preservation Commission, NYC DOT) to ensure compliance
- Use historically accurate designs to gain faster approval
- Construction Disruptions
- Schedule construction during low-traffic seasons to minimize disruptions
- Provide temporary pedestrian paths to maintain accessibility
- Offer business relief programs, such as temporary outdoor vending permits
Transformation Visualization 1
Prediction Analysis
Streetscape Visualization
To visualize our proposed streetscape transformations, we developed Stable Diffusion Street, an AI-powered street view image generator. This tool allows us to transform existing West Village street scenes while preserving their distinctive architectural character and spatial layout.
The tool offers several key features that were essential for our visualization process:
Map & Image Acquisition:
- Interactive Map Interface for navigating and selecting West Village locations
- Street View Capture functionality to directly capture representative street scenes
- Image Upload capability for incorporating our own street photography
Image Processing:
- Semantic Segmentation to automatically identify sidewalks, roads, buildings, and other urban elements
- Structure-Preserving Editing to maintain the original street layout while implementing changes
Editing Tools:
- Segmentation Editing through ControlNet to modify specific elements like sidewalk width
- Preservation Masking to protect the West Village's iconic architectural facades
Generation:
- Text-Prompt Generation to transform scenes based on our design specifications (e.g., "historic street furniture," "vintage lighting")
Using these features, we created before-and-after visualizations that demonstrate how our proposed interventions would enhance the pedestrian experience while respecting the neighborhood's historic character. The visualizations clearly illustrate the potential improvements in walkability, aesthetic cohesion, and public space utilization that align with our transformation goals.
Walkability Analysis
To analyze and visualize the impact of our proposed sidewalk widening interventions, we developed an Interactive Sidewalk Width Analysis Tool specifically for the West Village BID. This tool allows stakeholders to explore how changes to sidewalk dimensions affect pedestrian density and comfort throughout different times of day.
The tool provides several key analytical capabilities:
Time-Based Pedestrian Density Visualization:
- Morning (9 AM), midday (12 PM), and evening (7 PM) pedestrian traffic patterns
- Color-coded density indicators showing areas of potential congestion
- Hexagon aggregation view for broader density analysis
Interactive Width Adjustment:
- Select individual sidewalk segments for targeted analysis
- Adjust sidewalk widths using an intuitive slider interface
- Real-time calculation of pedestrian density metrics
Data-Driven Decision Support:
- Quantitative metrics showing before/after comparisons
- Identification of high-priority segments based on current pedestrian density
- Visualization of potential bottlenecks during peak hours
The analysis tool integrates actual pedestrian count data with spatial measurements of the existing streetscape, providing an evidence-based approach to our proposed interventions. This data-driven methodology ensures that our recommendations target the areas with the greatest need and potential impact.
Walkability Simulation
We have implemented a tool using the GAMA platform to simulate and visualize the effects of adding resting areas in the West Village BID. The goal is to enhance pedestrian walkability, especially for vulnerable populations such as the elderly or those with mobility limitations.
GAMA enables us to model real-world pedestrian behavior through agent-based simulation. Each pedestrian agent is programmed with behaviors such as:
- Walking forward
- Slowing down when crowded
- Seeking rest when fatigued
We developed two simulation scenarios:
- Baseline: Pedestrians move through the BID under existing conditions, with limited access to seating.
- Intervention: Additional benches are installed throughout the area, offering more opportunities for pedestrians to rest.
By comparing the two simulations, we observed a reduction in pedestrian fatigue and a more even distribution of foot traffic in the intervention case. This demonstrates that even small design interventions can improve urban comfort and accessibility.
Before Intervention
Baseline scenario: Pedestrians move without added benches. Red tiredness indicators cluster in key areas lacking rest infrastructure.
After Intervention
Intervention scenario: With benches added, tiredness indicators decrease and spread out, showing improved pedestrian recovery and comfort.
Tiredness Levels Visualization
Dot colors represent tiredness levels:
🟢 Green = Energetic
🟡 Yellow = Moderately Tired
🔴 Red = Very Tired / Needs Rest
In the baseline simulation, red clusters indicate pedestrian fatigue due to the lack of rest areas. In the intervention scenario, those red zones begin to fade — signaling a more walkable and supportive environment.
Interactive Scenario Planning
In addition to visualizing fatigue patterns, our GAMA model serves as an interactive planning tool. Decision-makers can:
- Adjust the number and location of resting areas
- Explore multiple design configurations
- Observe how pedestrian flow and comfort levels shift in response
This enables low-risk exploration of “what-if” scenarios, supporting smarter, data-driven design decisions before implementation begins.
Aesthetic Elements Visualization with InCitu
Revitalizing a neighborhood isn’t only about adding infrastructure — it's about restoring a sense of place. To support our walkability interventions, we used InCitu, an augmented reality (AR) platform, to visualize aesthetic improvements directly within the West Village streetscape.
InCitu allows us to overlay vintage-inspired urban elements onto real-world street views using a mobile device. These AR renderings help stakeholders and community members preview how historic features can enhance the pedestrian experience.
Proposed Aesthetic Interventions (Click to view in InCitu):
These elements are more than just upgrades — they evoke the rich cultural history of the neighborhood and encourage passersby to slow down, observe, and enjoy their surroundings.
On-Site Visualization
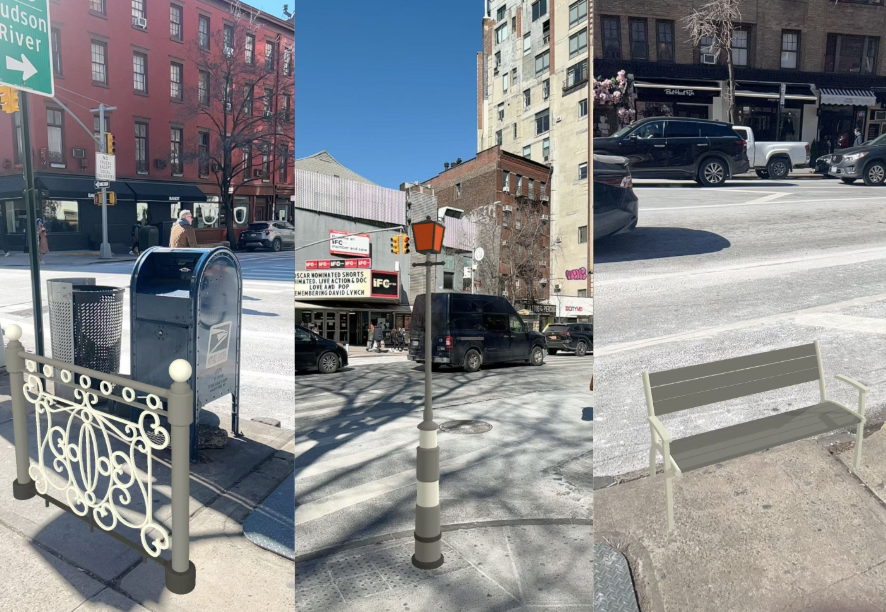
Vintage design elements — including barriers, lighting, and benches — rendered at full scale in their future locations using InCitu.
Real-Time Decision Support
InCitu turns aesthetic planning into an interactive, immersive experience. Stakeholders can:
- Place, resize, and rotate elements in context
- Visualize designs at street level before implementation
- Engage in collaborative decision-making without needing design expertise
By making proposed changes feel real, InCitu helps bridge the gap between concept and consensus. This tool supports a more inclusive design process and ensures our streetscape interventions are not just functional, but meaningful.
Economic Impact
Business Activities
There are some BID made similar improvements. In Brooklyn's Dumbo section, the retail sales jumped 172% three years after the first pedestrian plaza opened. On Pearl Street, sales during peak seasons increased 14% in stores along a mini plaza. Open Streets corridors provided an averaging 19% sales boost for restaurants and bars.
Therefore, the interventions should also lead to a 20% increase in business activities.
Employment Opportunities
Long-Term Growth in Tourism will create more Employment Opportunities and increasing the local economy. Restaurants, retail shops, guided tours, and artisan markets need more staff to run the business. Based on 20% increase, this is estimate increase of job opportunities.
| Current Employment | Predicted Employment (Post-Intervention) | Net Gain | |
|---|---|---|---|
| Cafés & Restaurants | 150 | 180 | +30 |
| Retail Shops | 50 | 60 | +10 |
| Guided Tours | 10 | 15 | +5 |
| Artisan Markets | 8 | 12 | +4 |
Prediction Visualization 1
Prediction Visualization 2
Prediction Visualization 3
Consensus Analysis
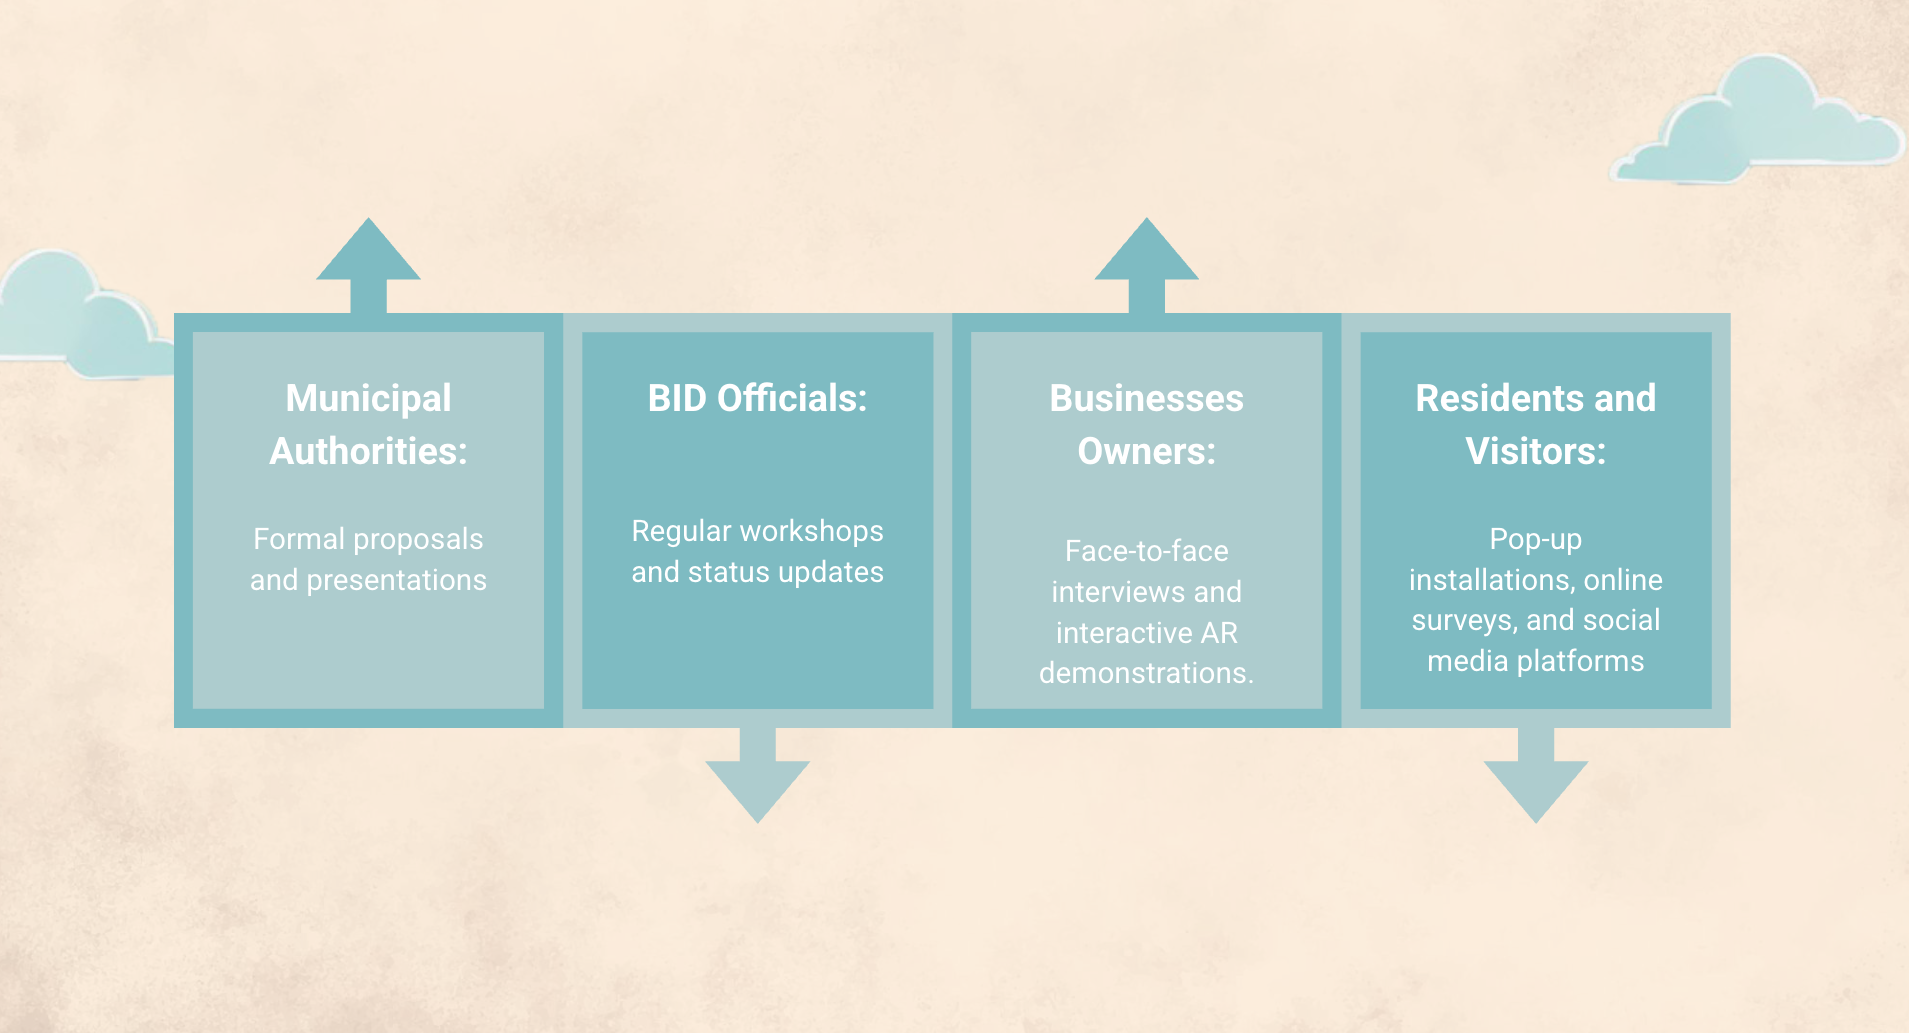
- Strategy for Public Engagement Because successful urban interventions hinge on community buy-in, we devised a multi-pronged public engagement strategy. It included open workshops, online surveys, and pop-up installations. The aim was to gather input from residents, business owners, and visitors early and often—ensuring that design decisions reflect local needs.
- Communication Between Agents In our agent-based models, we conceptualized city stakeholders (municipal authorities, the BID board, residents, merchants) as distinct “agents” with unique interests. We then established communication channels—public forums, newsletters, neighborhood apps—to facilitate dialogue. This real-time feedback loop allowed quick adaptation of proposals, reducing friction between parties with differing priorities.
- Collaborative Decision Process Finally, we proposed an ongoing collaborative framework wherein data-driven simulations, AR visualization tools, and community input converge to guide final decisions. By layering insights, transformations, and predictions in one shared platform, all parties can weigh in on trade-offs and refine proposals. This cyclical, consensus-focused process aims to produce more inclusive, lasting outcomes for the West Village BID.
Consensus Visualization 1
Additional Resources
Data & Methodology
Data Sources
NYC Open Data, West Village BID Annual Reports, Census Data, Tourism Statistics